
Measuring the success and improvement of your recruiting strategy is hard. Ultimately, what all HR managers and business leaders want to see are results. But how do you quantify success and failure in the recruitment space?
Luckily there is a set of logical and easily trackable metrics for just this purpose. If you want to understand what the most important recruiting metrics are, and how you can use them to gauge your recruiting efforts, this article is for you.
What are Recruitment Metrics?
Recruiting metrics are measurements that allow managers to track the success of hiring and optimize recruiting for an organization. These metrics also help managers evaluate their organization’s hiring processes and help them understand whether they’re recruiting the right people.
The recruiting cost of a new employee in the US is around $4,000 according to Glassdoor, and that’s if it’s a good hire. Northwestern estimates the cost of a bad hire to be about 30% of their expected annual earnings. This is a huge financial incentive for organizations to pay close attention to their recruiting success and optimize for only making good hires. The variables to monitor here are recruitment metrics such as quality of hire, retention rate, and first-year attrition.
We’ve compiled a list of the five absolute key recruiting metrics HR needs to track. We also take a closer look at why each recruitment metric is important and how to calculate them for your organization.
Let’s dive in!
The 5 Most Commonly Used & Effective Recruiting Metrics
These key recruiting metrics are what top HR leaders use to assess the overall business value of their team’s recruitment efforts.
Time to Fill
To Monitor How Long You Need to Find a New Employee
Time to Fill is defined as the time it takes for an organization to hire a new candidate.
It is typically measured by the average number of days between approving a job requisition and having the successful applicant reach your definition of “fill”. This can be the time they accept the job offer, start their first day, or complete onboarding.
Time to fill is among the top drivers of ROI for new initiatives taken by HR. The metric allows managers to dive deeper and optimize their hiring by looking at each stage of the process.
For example, your average time to fill might be 40 days, but 50% of that time is spent sourcing the right candidate, while the remaining stages such as interviewing and background checks are comparatively quick. This tells you what to focus on to optimize the process and speed things up.
Why is Time to Fill Important?
Knowing your Time to Fill and comparing it periodically to past performance, as well as with the industry benchmarks, can tell you whether you need to review your recruiting process.
Let’s consider the example of a sales role that generates $1000 daily. If the Time to Fill benchmark for this position is 40 days but you’re taking 45, that’s $5000 per hire you’re losing out on. If you hire 100 sales people per year at the same Time to Fill rate, this amounts to leaving $500,000 on the table annually.
Similarly, keeping the above example in mind, optimizing your hiring process to reduce your Time to Fill to 35 days would save $5000 per hire compared to the industry, giving you an ROI of half a million dollars per year.
By the way, projecting and calculating the ROI on implementations you make, such as reducing your Time to Hire, is a valuable skill that surprisingly few people in HR have. Set yourself apart from the pack by taking our free course on HR tech ROI calculations.
Organizations can reduce their Time to Fill using a variety of tactics, including:
- Having a robust candidate database
- Developing a strong candidate referral program
- Integrating an interview scheduling software
How to Measure Time to Fill
Time to Fill is calculated by counting the number of calendar days it takes to meet your metric’s goal, from the date of job requisition approval. Depending on how you are measuring, the goal can be to reach offer acceptance, for a new hire to start their first day, or for them to complete onboarding.
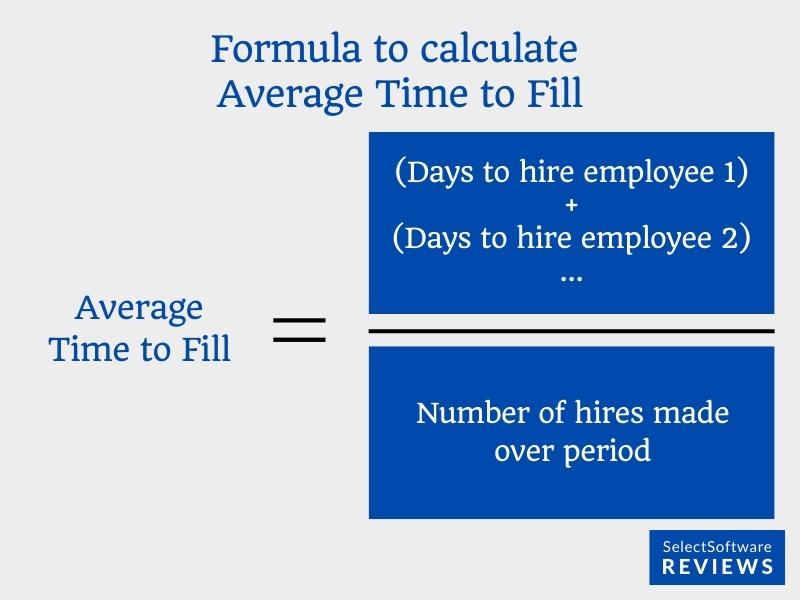
The average Time to Fill for an organization is calculated by adding all the Time to Fill numbers for a given period and dividing it by the number of hires for the same period.
Average Time to Fill = (Time to Fill position 1+Time to Fill position 2 +…+ Time to Fill position n) / Number of hires in the same period
For example, if you hire three employees in a quarter and the Time to Fill for each one was 30, 40, and 50 days respectively, your average Time to Fill for the quarter would be (30+40+50)/3 = 40 days.
APQC recommends measuring Time to Fill annually. The global Time to Fill benchmark for non-executives across all industries is 54 days according to the Society for Human Resource Management. Of course, this varies depending on the industry and the tools you have available to streamline your recruitment process.
Software for Measuring and Improving Time to Fill
You can measure and optimize Time to Fill using an Application Tracking System (ATS). The best ATS software can help you reduce Time to Fill by:
- Making high-quality candidates easily accessible with mobile-optimized application workflows.
- Improving candidate experience, leading to faster interview cycles and higher acceptance rates.
- Offering better workflows that boost recruiter productivity.
Depending on your needs, we recommend:
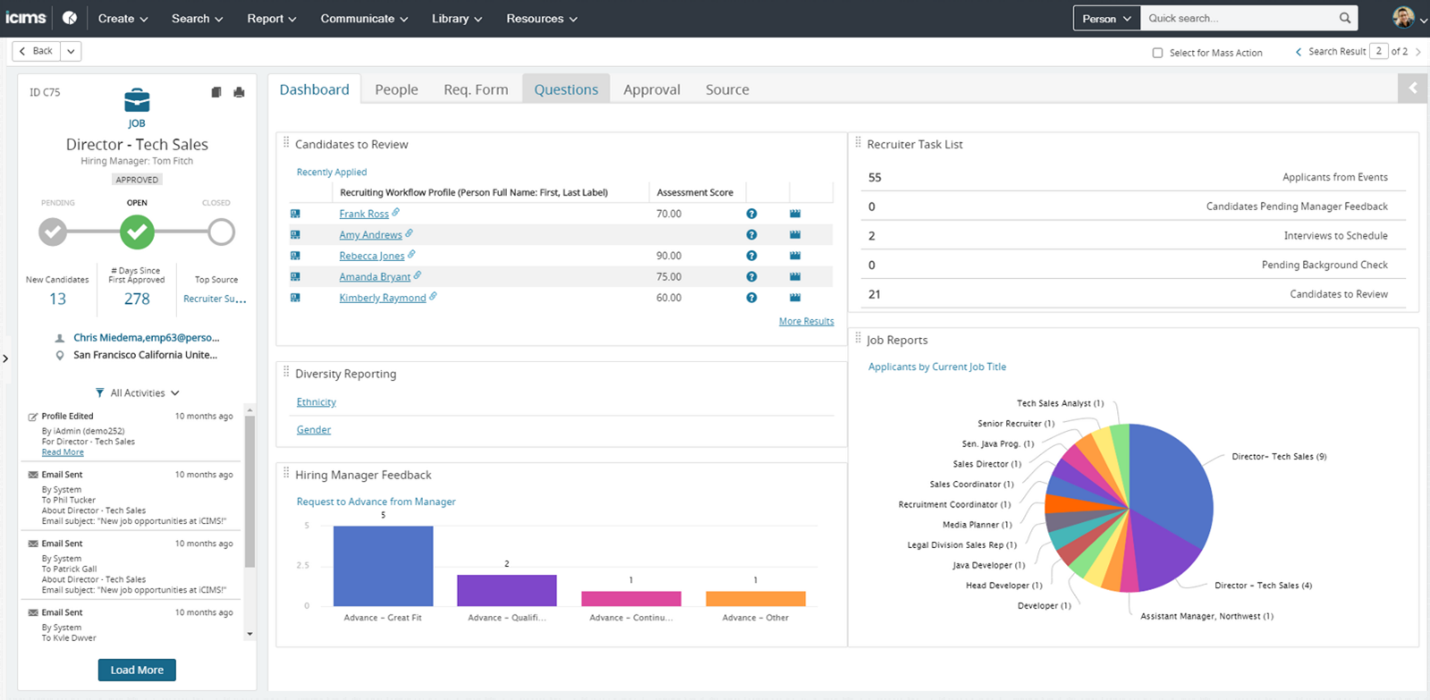
- iCIMS - For large organizations
- BreezyHR - For small-medium businesses
- Workable - For its AI-powered sourcing tool and over 400 million candidate records
Cost Per Hire
To Analyze What it Costs to Find the Perfect Fit
Cost Per Hire measures the various costs associated with filling a job position. These costs pertain to sourcing, recruiting, and staffing an open position and may be direct, indirect, internal, or external. Examples of such costs are:
- Recruiter (agency) fees
- Advertisements and sponsored postings (for example on LinkedIn or job boards)
- Assessment tools
Why is Cost Per Hire Important?
Cost Per Hire is considered a core recruiting metric. Not only does it allow HR to forecast budgets for particular roles, locations, and channels, but it also helps you understand what’s working best and where to focus your efforts.
The Average Cost Per Hire benchmark for an industry tells businesses what they should be spending to acquire new talent. According to AIHR, the metric allows firms to make strategic decisions regarding investment in recruiting. This includes the costs involved in the general hiring process and the cost of hiring for hard-to-fill roles.

If an organization finds its Cost Per Hire metric above the industry benchmark, it may have to review the health of its employer brand, compare compensation and benefits offered with competitors, and look closely at each step of the hiring process to identify inefficiencies.
How to Measure Cost Per Hire
Cost Per Hire is expressed as an average and is calculated by dividing the sum of all recruiting costs over a specific period by the total number of hires in that period.
Cost Per Hire = (Total internal recruiting costs + external recruiting costs) / Total number of hires
As an example, let’s say the total recruiting cost for an organization is $46,000 for 10 hires in the last 12 months. The Average Cost Per Hire, in this case, would be 46000 / 10 = 4600.
According to SHRM, the global average Cost Per Hire is $4,683.
Software for Measuring and Improving Cost Per Hire
Application Tracking Systems can reduce Cost Per Hire by taking care of job postings, sorting through resumes, maintaining communication with the hiring candidates, and scheduling interviews with qualified candidates promptly. This saves on the hours your HR team spends on performing these tasks.
Naturally, the highest cost-saving results are the ones you’ll get from implementing free software. Here are some of the best free ATS options you can try:
Freshteam - Free for up to 50 users
Zoho Recruit - Supports 26 different languages
VanHack - Connect with top talent within 48 hours
Top of the Funnel Conversion
Measure Your Employer Brand Effectiveness
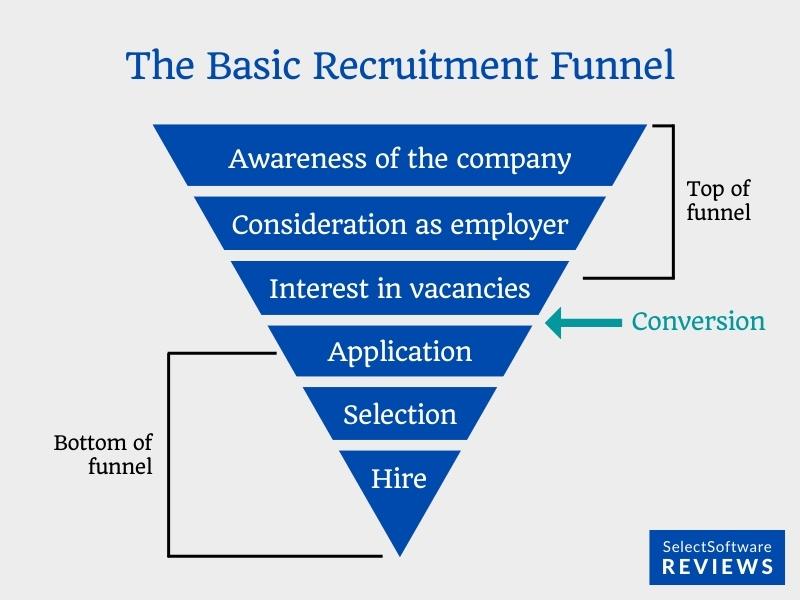
The conversion rate at the top of your recruiting funnel measures how well you’re portraying yourself as an employer online. This is influenced by all the channels your potential applicants would look at, such as on your career website or LinkedIn page.
The top of the recruiting funnel is where a potential applicant becomes aware of a job posting through an ad, your careers page, or even through a recruiter. A conversion at this stage means the visitor signs up and applies for a job.
Why is Top of the Funnel Conversion Important?
According to a survey by Jobvite, a top-of-the-funnel conversion rate of 11% is considered excellent. A reasonable conversion rate indicates confidence in your employer brand and a candidate’s eagerness to work with your organization.
On the other hand, if your conversion rate is below industry standards, it indicates the need to strengthen your employer brand, optimize the user experience of your career site, and review your overall employer brand communications strategy.
The Top-of-the-Funnel conversion rate can also help to reduce your Cost Per Hire. Let’s say your careers website costs $1000 per month to maintain and generates 1000 monthly visits, resulting in 20 applications. That’s a conversion rate of 2% at a cost of $50 per conversion.
If the same website is optimized for conversions and then brings in 40 applications, the conversion rate doubles to 4%, cutting down the cost per conversion by half to $25. Consequently, a lower cost per conversion factors into the cost of hiring, reducing the Cost Per Hire metric.
How to Measure Top of the Funnel Conversion
Expressed as a percentage, the top of the funnel conversion rate for a recruiting channel is calculated by dividing the total number of job applications received from that channel, for example, your careers page, by the total number of visits to the page.
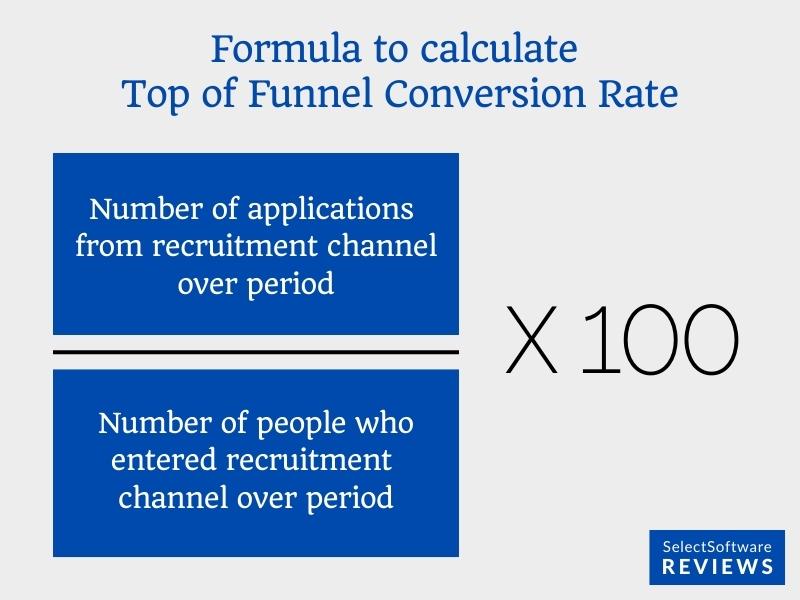
Top of the Funnel Conversion Rate = (Number of job applications received from a recruitment channel / Total number of visits to that channel) x 100
For example, if 100 people apply for jobs from a careers page that receives 1000 visits in a month, the monthly top of the funnel conversion rate for this channel would be: (100 / 1000) x 100 = 10%
Pass Rate
Identify Bottlenecks and Inefficiencies in Your Hiring Process
Pass Rate, also known as Pass-Through Rate (PTR), measures the number of candidates that move from one round of the application process to the next - from initial job application to screening, to interview, to offer, to hiring. The benchmarks for Pass Rate vary by industry and job role.
Why is Pass Rate Important?
Pass Rates can be measured for any recruitment variable you want to monitor. For example, the hiring generated by each recruiting channel, types of job roles, geographies, and recruiter. When compared with industry benchmarks, these metrics can reveal inefficiencies and bottlenecks in the hiring process.
For example, if the screening-to-interview rate is high compared with industry standards, too many candidates are being allowed to pass on to the next stage, wasting precious time and resources available in your HR department. This can be addressed by tightening the selection criteria at this stage.
Pass Rate can also be used to conduct a cost-benefit analysis on individual channels. For example, if your careers website is costing you $1000 to maintain but has a Pass Rate of only 2%, this may not be a viable channel for your organization.
How to Measure Pass Rate
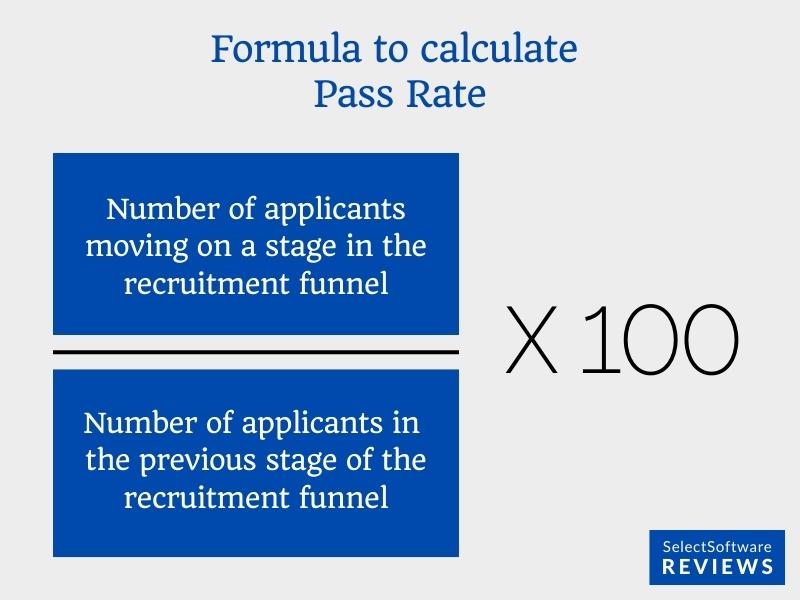
Expressed as a percentage, Pass Rate is calculated by dividing the total number of candidates that passed to a certain stage in the recruitment funnel with the number of people just above it. For instance, of all the applications received, how many candidates were interviewed, of all the candidates interviewed, how many passed a skills assessment, and how many were ultimately hired.
Pass Rate = (Number of candidates who advanced to the next stage in the recruitment funnel / Number of candidates in the previous stage) x 100
For example, if 50 out of 100 candidates advance from the screening round to the interview stage, the Pass Rate for the stage would be: (50 / 100) x 100 = 50%
The metric can be calculated on a quarterly or annual basis and monitored for each stage in the hiring process.
First-Year Attrition
See How Your Retention Efforts Work
First-Year Attrition, also known as Early Turnover and New Hire Turnover, is an important recruiting metric for monitoring retention. It indicates the health of a company’s onboarding and culture efforts by measuring the number of employees that leave the organization early on - typically within a year of joining.
Why is First-Year Attrition Important?
Early employee exits may be voluntary or involuntary. The former is likely a result of poor expectation management, while the latter is often a consequence of poor performance or a bad fit with the team.
First-Year Attrition is linked to an organization’s talent acquisition process and employee onboarding practices. If the metric does not meet the minimum industry benchmark, it raises questions about how effectively hiring managers and the recruiting teams are filtering candidates, and managing candidate expectations.
There are other possibilities for Early Turnover as well. Maybe the employee wasn’t happy with the level of training they were offered. Perhaps they didn’t feel valued. HR should do its best to find out the actual reasons for the separation so the issues can be addressed for future hires.
First-Year Attrition has a direct impact on a company’s bottom line. A new hire that leaves within a year depletes profits by increasing the company’s overall Cost of Hiring. Furthermore, a high attrition rate negatively affects employee morale, damages the employer brand, and impacts the budget for making new hires.
Knowing and tracking the average annual attrition rate can help HR plan ahead while taking measures to improve the metric. These efforts can include engaging new employees right from the onboarding stage and setting clear and realistic expectations.

How to Measure First-Year Attrition
The formula for First-Year Attrition is:
(Number of employees who leave within their first year /Total number of separations during the same period) x 100
How to Use Recruiting Metrics to Enhance the Recruitment Process
According to PwC, HR costs make up 28% of a company’s total operating expenses, on average. Suboptimal recruitment and high employee churn are major costs for HR. In fact, SHRM states that replacing an employee can cost up to 50-60% of their annual salary. This makes the insight gained by monitoring recruiting metrics in the recruitment process all the more important.
A data-driven recruitment process is of strategic value to an organization. Recruitment metrics, as we’ve discussed here, help you track and justify the time and money spent on specific recruiting processes.
In addition, every stage of the recruitment funnel can be tracked and optimized by location, function, and channel to drill down into sub-processes and optimize for efficiency. Let’s look at some of the ways an organization can enhance its recruitment process using recruiting metrics.
Monitoring Metrics by Source of Hire to Track Channel Efficiency
Employee referrals are generally known to be the best Source of Hire. But that may not always be true for your organization.
Each of your hiring sources costs money. Employee referrals usually have referral bonus incentives, job boards charge a pay-per-click fee for every visitor they send to your job post, and so forth.
Measuring the HR metrics according to Source of Hire can show you where the majority of your candidates are coming from, as well as the ROI and conversion on each of the sources.
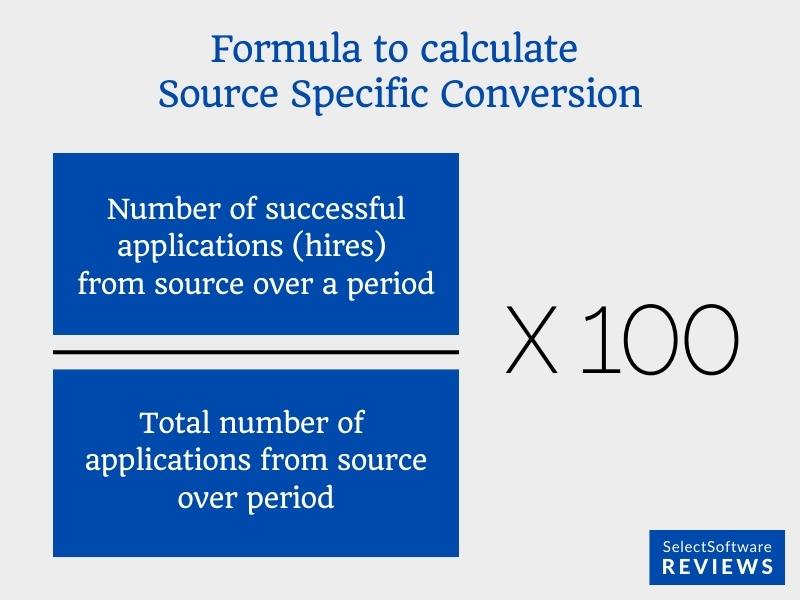
The conversion rate of a recruitment source is the percentage of hires it generates from the number of candidates it produces.
Tracking the Source of Hire for each of your channels allows you to invest your money in the channels that are producing the best candidates for you and eliminate the inefficient ones.
You can also boost your talent acquisition efforts using talent sourcing software that allows you to reach new talent pools and engage the right candidates quickly. Talent sourcing software is a great potential Source of Hire because the best sourcing tools have their own databases and can process thousands of applicants automatically.
Tracking your Application Completion Rate to Determine the Effectiveness of Your Application Process
According to Recruiter, 10.6% of potential candidates on average will complete a job application that asks fewer than 25 questions. This number drops to 5.7% if the application asks more than 50 questions.
Understandably, hiring managers want to filter out candidates at the very beginning of the application process. But this want has to be balanced with the need to make the process easier for job seekers. Applicants don’t want to feel overwhelmed and wouldn’t want to invest too much time in a job application process that may or may not yield positive results for them.
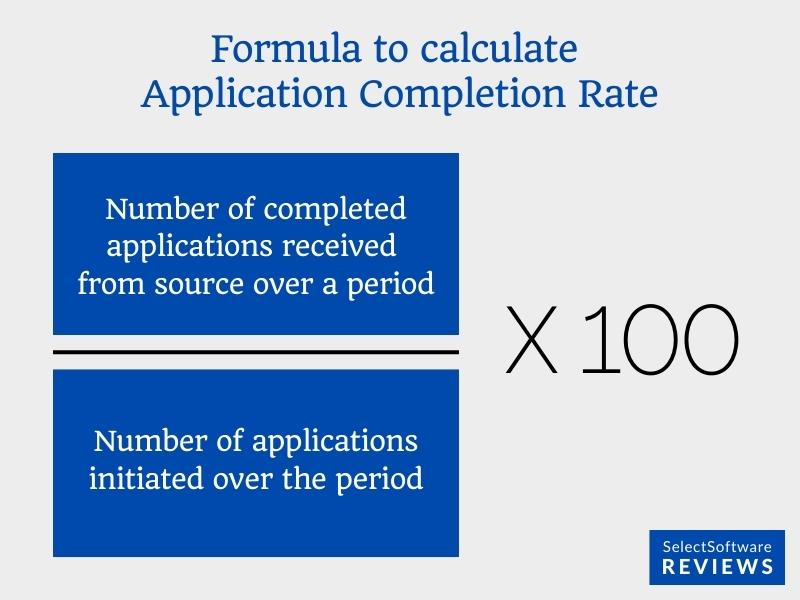
Measuring your Application Completion Rate can give you insights into whether your application process is too lengthy, what the drop-off rate is over time, and at what point in the process job seekers are quitting the application.
Application Completion Rate can be calculated by dividing the number of applications completed by the total number of applications started.
Offer Acceptance Rate to Assess the Competitiveness of Your Job Offers
Another way to enhance your recruitment process is to improve your offer acceptance rate. This metric tells you how well you’re meeting the expectations of the top talent you’re looking to hire.
According to Glassdoor, 17.3% of the job offers made in the United States are rejected. This number has been on the rise for the last few years as job applicants continue to compare and scrutinize job offers more closely through social media and other services like Glassdoor and Payscale.
To improve your Offer Acceptance Rate, make sure to conduct your own research before drafting job offers. Your job offers should ideally be on par with, or exceed, industry benchmarks to be considered by top talent.
Maintaining communication, setting the right expectations throughout the hiring process, from the job description to the interview, and introducing candidates to their potential coworkers are some additional steps you can take to boost your Offer Acceptance Rate.
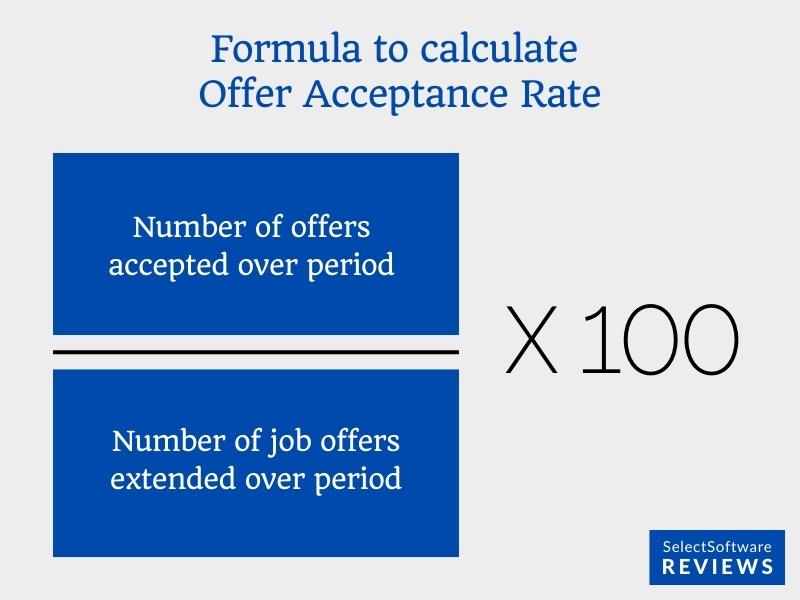
Offer Acceptance Rate is expressed as a percentage. The metric can be calculated by dividing the number of job offers accepted by the total number of job offers extended.
More Ways to Enhance Your Hiring Process
To further drill down and look at each aspect of your hiring process in the context of recruiting metrics:
- Measure your Applicant to Interview rate to assess the health of your applicant screening process. If the rate is too high, you may be wasting company resources by interviewing too many candidates.
- Calculate the Interview to Offer rate to determine whether you’re sending the right kind of candidates through to interviews. If there are too many interviews and not enough offers, the pre-interview screening processes likely need some tightening up.
- Look at each stage in the recruitment funnel to optimize for Time to Fill so you can cut down the time period between job requisition approval and offer acceptance. What stage in the funnel in taking the most amount of time? Is there a bottleneck in management approvals? Is sourcing taking too long? Identify and focus on areas of improvement.
- Have your recruiting budgets ready for the next year by tracking your retention rates and estimating the number of new hires you’d need.
The Best Recruitment Metrics Templates to Track Your Recruitment Efforts
Here are some of the best recruitment metrics templates we have found.
- Recruitment Tracker Excel Template: This template from Someka will help you track important recruiting metrics such as Cost Per Hire, Time to Fill, Source of Hire, and more. In addition, the template includes the ability to visualize the data in the form of charts and graphs. You can view the free version and download the editable version of the template.
- Recruitment Manager: This robust paid template can easily track and report a number of recruiting metrics including Time to Fill, Cost Per Hire, Total Cost of Hiring, and Source of Hire. A free version of the template is available here, however, it has its limitations.
- Employee Retention Rate Calculator: This straightforward employee retention rate template by BuiltIn allows HR Managers to easily keep track of retention rates by answering a few simple questions.
- SSR ROI Calculators: For a wide range of calculators to measure the various aspects of your recruitment efforts, check out our ROI Calculators page. From time to fill to recruiter productivity to conversion rates and more, we have it all covered here.
Examples of Recruitment Metrics Dashboards
Here are some good examples of recruitment metrics dashboards.
- Recruitment Dashboard by Geckoboard
- Recruitment KPIs by Geckoboard
- Recruiting Dashboard by HackerEarth
- HR Recruitment Dashboard Sample by Bold BI
- Recruitment Tracker Dashboard by Chandeep
Our Conclusion on Recruitment Metrics
HR’s role is no longer limited to just talent acquisition. The function is of strategic importance to organizations and has the potential to add immense value, supported by the right recruitment software.
Using recruiting metrics, this value-addition can truly be highlighted in terms of time and cost savings, for instance by minimizing Time to Fill and First-Year Attrition, while boosting Top of the Funnel Conversion.
HR can also directly contribute to the bottom line by analyzing each stage of the recruiting process, eliminating bottlenecks, and consequently, reducing Cost Per Hire.
Above all, recruiting metrics help HR move beyond the subjectivity of merely hiring. Instead, HR’s work is measured in a quantifiable manner, and improved over time through granular optimization.