

ChartHop’s value lies in consolidating what would normally require multiple point solutions into a single environment. For mid-sized and global organizations, especially those with distributed teams and a need for transparency, the platform makes it possible to connect performance, pay, diversity, analytics, and planning in a way that drives better-informed and more equitable decisions.
Ratings
Ease of Use
Best For
Key Differentiator
Price
Free Trial
PROS
- Integrates performance reviews with live business data (e.g., Salesforce) for more objective conversations.
- AI summaries distill open-text feedback; calibration (alpha) helps normalize ratings before finalizing.
- Strong analytics with historical “time travel,” drill-downs, and customizable dashboards.
- Compensation: run salary/bonus/equity cycles with contextual org + performance data and visual comp letters.
- Headcount planning: visual scenarios, side-by-side comparisons, and AI-generated draft plans.
- Open API; HRIS/ATS/payroll integrations; role-based access for sensitive data.
- Mobile app supports completing reviews, surveys, and tasks across devices.
CONS
- Learning curve can be steep due to frequent feature additions and configuration depth.
- Onboarding typically takes weeks to 2–3 months for multi-module rollouts.
- UI can lag with very large org charts or complex visualizations.
- Assisted help for custom templates capped at six per customer.
- Free plan discontinued; $9,000 annual minimum on paid plans.

Need Help? Talk to an HR Software Advisor!
Tell us more about your company & an HR Software Advisor will help you find the right software


ChartHop has grown from its beginnings as an org chart tool into a comprehensive people operations platform that brings performance management, compensation, DEI analytics, people analytics, and workforce planning into one unified system. The common thread across all of these modules is that they are powered by a single, connected dataset. Instead of relying on exports or separate tools for reviews, pay cycles, or headcount planning, organizations can make decisions in ChartHop with data that is always up to date and consistent across functions.
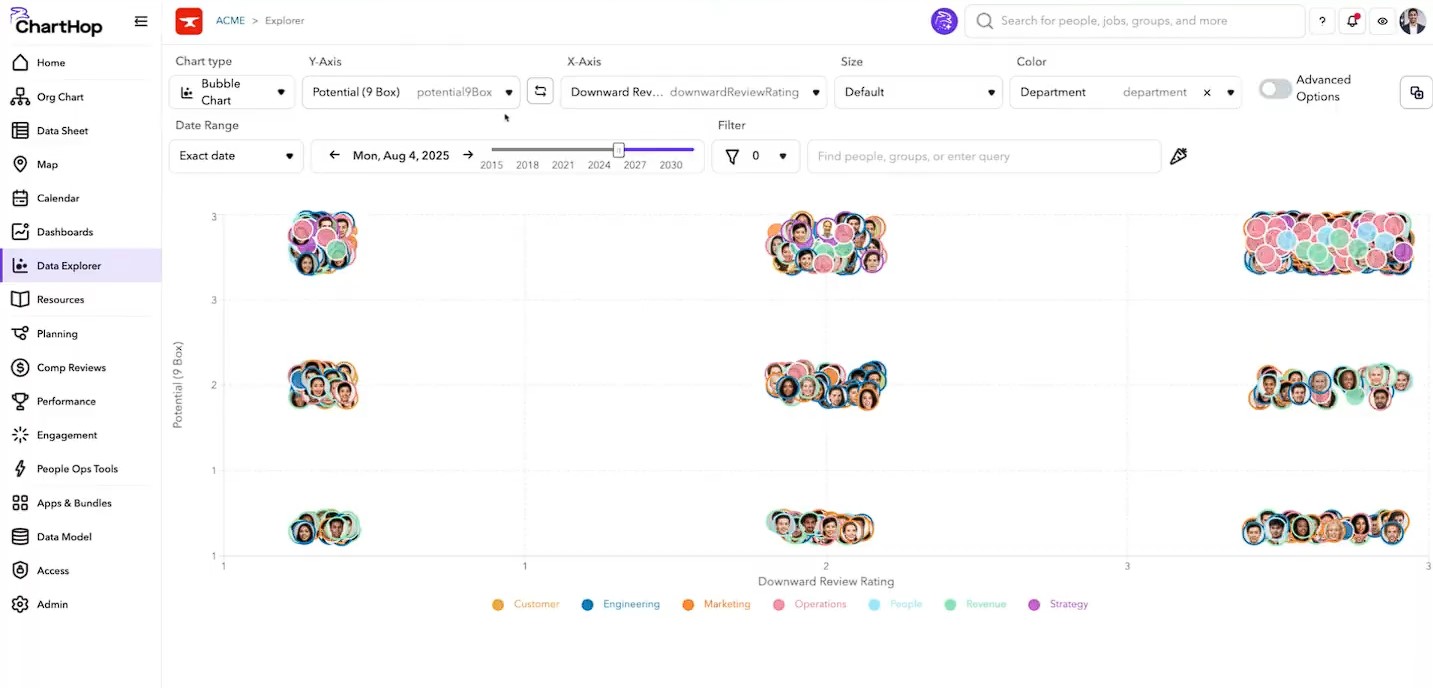
Its performance management module is a good example of this approach. Reviews can be customized by department or role, with flexible workflows, templates, and access settings. ChartHop’s AI-generated summaries distill long-form feedback into trends and highlights while still leaving the original responses available for transparency. Managers also benefit from the calibrations view, which makes it easier to compare ratings side by side and spot inconsistencies before finalizing outcomes. What makes this module distinctive is its ability to integrate live business data into the review process. Sales and customer-facing teams, for instance, can have revenue metrics pulled directly from Salesforce to ground feedback in real performance numbers rather than subjective impressions.
Compensation management in ChartHop is similarly integrated. Salary, bonus, and equity cycles can all be configured and run in the platform, with compensation decisions automatically linked to performance and engagement data. HR and finance teams can build approval flows with budget thresholds, ensuring governance while still giving managers flexibility. Once a cycle is complete, the platform generates visual compensation letters that make it easier for managers to communicate pay changes consistently and clearly. This capability reduces misalignment between HR, finance, and frontline managers and helps employees understand how their compensation is determined.
On the DEI front, ChartHop provides analytics and scenario modeling that let organizations understand representation in detail and over time. Workforce data can be segmented by gender, ethnicity, tenure, and department, with historical “time travel” views to see how metrics have shifted. These insights are especially powerful when used in conjunction with headcount planning. Leaders can model changes, such as increasing representation in leadership roles, and instantly see the budgetary and organizational impact. Sensitive demographic data is safeguarded through role-based permissions, so DEI analysis can be shared appropriately without compromising privacy.
The analytics capabilities in ChartHop are not sold as an add-on but are built into the platform. Dashboards and reports make it possible to move from high-level organizational trends down to specific employee data with just a few clicks. Leaders can examine attrition patterns, track the progress of KPIs, and evaluate the long-term effects of past policy changes. Because the analytics engine is tied to the same data powering performance, comp, and planning modules, these views are always grounded in the most current information.
Headcount planning is another area where ChartHop differentiates itself. Leaders can run visual “what-if” scenarios by reorganizing reporting lines, adding new roles, or removing positions, and the system will immediately show the financial impact. The AI-driven planner can even generate draft scenarios from simple prompts, such as increasing headcount in a particular department by a percentage. When connected to business data from systems like Salesforce, these models become more than hypotheticals as they reflect real demand and budgetary constraints.
Beyond its core modules, ChartHop also supports engagement surveys, 1:1 scheduling, and onboarding/offboarding workflows. While these features are not as deep as those offered by dedicated engagement platforms, their strength lies in being tied directly to compensation, performance, and planning data. This integration helps HR teams view employee sentiment in context with other organizational factors.
The platform’s breadth of features does come with trade-offs. ChartHop has a steep learning curve, especially for new users trying to understand how frequent product updates fit into existing workflows. Onboarding can stretch over several weeks or even two to three months, depending on company size and complexity, and organizations with very large datasets or intricate org charts may experience occasional performance lags. Assistance with creating custom templates is also capped at six, meaning companies with more specialized reporting or review needs may need to supplement internally.


ChartHop harmonizes information from our HRIS and ATS, providing us with a dynamic org chart that displays our current team as well as future hires; we can easily scroll in time to see historical and future statuses. We can also view data by department or location as needed. The map view is a tremendous help in visualizing our organizational distribution across the globe.
The data sheets option offers data in excel format. The automatic sync option into Google Sheets is a bonus and makes collaborating a breeze. We have stopped using our HRIS reporting feature and instead review data through ChartHop.
The UI is very appealing and well laid out. I like the dashboard and the components of what is included. It has beautifully developed org charts. Extracting data from the data sheet tab is easy. ChartHop compiles data from HRIS and ATS to create a robust database to build reports and organization structures. The support and product assistance is great.
We were looking for a comprehensive "1-stop" shop for critical People Analytics. We've been using ChartHop for over two years and are very satisfied with the data management and reporting capabilities. While our HRIS system offered some basic dashboard options, there were a lot of gaps, and we don't have the capacity to build the dashboard internally. We started with the free version which offered minimal yet useful insights and have remained impressed ever since. The Org Charts in a single platform is a dynamic solution. ChartHop has completely changed the way we look at employee data.
Charthop is not the most user-friendly where mapping custom fields and building reports is concerned, and they could have more self-service options available so that one-to-one support is not needed. Charthop can seem difficult to use at first and the implementation process can be overwhelming.
Charthop is unique in the way performance reviews transfer to the compensation section. There's also a variety of options for viewing employee information. Charthop is better than our HRIS for delivering information, and is one of the best employee dashboard analytics available for the cost, service and capabilities offered.
It is most important to consider integrations and compatibility with other systems as this is pivotal to the success of this platform within any organization. It is equally important to consider how information will be uploaded/downloaded. Lastly, consider the features needed; customization can be tricky with Charthop, so if there are specific data/analytics needed, it is imperative to ascertain whether these data sets are possible to extract from this platform.
Charthop is ever evolving to meet user needs and is transparent in its communications of such via regular notifications and emails. There have been improvements to data fields and sorting and filtering functions.
Organizations of any size and within any industry could benefit from Charthop. Charthop has different packages offering a variety of features, making it easy to adapt to an organization's changing needs through periods of growth, expansion and/or transition.
Charthop is not a good choice for organizations seeking a cheap or low-cost option; although the free version offers wonderful insight, the paid versions offer the complete picture, and can be costly by comparison to HRIS included functions.
Crunchr
Crunchr
ChartHop
ChartHop

Lattice
Lattice
Agentnoon
Agentnoon

OrgVue
OrgVue
- Companies <50 employees or those wanting a lightweight org chart only.
- Teams seeking a payroll-first system over analytics/planning.
- Orgs that need a tool live immediately without multi-week onboarding.
Remy Cointreau, InVision, Sequoia, BetterCloud, and Postman
- Performance Management: configurable cycles, templates, access controls; AI summaries; calibration (alpha); real-time + scheduled feedback; KPI/CRM data in review.
- Compensation Management: run salary/bonus/equity cycles; configurable approvals and budgets; visual comp letters; pay decisions linked to performance/engagement data.
- DEI Analytics: granular segmentation (e.g., gender, ethnicity, tenure); historical “time travel”; scenario modeling aligned to headcount plans; multi-language support; role-based privacy.
- Workforce Planning: visual scenario modeling, AI-generated draft plans, cost forecasting, side-by-side comparisons, and approval workflows.
- People Analytics and Org: dashboards, heat maps, drill-downs; dynamic org charts, employee directory/map; onboarding/offboarding; payroll sync.
- Mobile App: complete reviews, surveys, and tasks on the go.
Charthop integrates with a variety of applicant tracking systems, HR tech stacks, productivity tools, and communication channels. Some of them include Slack, Google, BambooHR, Workday, SAP SuccessFactors, Greenhouse, Lever, Gusto, Zenefits, etc.
If you're looking for integration with a tool not on the list, you can always reach out to one of their sales representatives and have your queries answered.
- Basic: $2 PEPM, no minimums (org charts + employee data).
- Core Modules (Performance, Compensation, Engagement, Analytics, Workforce Planning, DEI, HRIS): $8 per employee per month (PEPM) for the first module, $4 PEPM per additional module; $9,000 annual minimum.
- Implementation: one-time fees scoped separately.
- Free Trial: Yes. (Free plan discontinued.)
Mid-sized and global organizations that want reviews, compensation, DEI, analytics, and headcount planning connected to live business metrics and prefer one modular platform over multiple point tools.
Expect a multi-week to 2–3 month rollout depending on module count, data sources, and workflow complexity. Plan for integration mapping (HRIS/ATS/CRM/payroll), role-based access setup, template design (within the six-template assistance limit), and enablement for admins/managers.
Dedicated onboarding, live training, help-center resources, and account management. Customers highlight responsive teams; advanced orgs may need internal analytics/ops resources for highly tailored dashboards or beyond-six template needs.
ChartHop was founded in 2018 by Ian White, who first started building the software to fill what he felt were gaps in his own knowledge when he founded, ran, and eventually sold his previous company, Sailthru. He firmly believes that when it comes to scaling a business, understanding how departments, people, and the organization as a whole work is key to success. And that’s why he established Charthop.
Today, Charthop aims to support leaders in scaling productive, transparent, and intentional organizations. The company is backed by organizations like Andreessen Horowitz, Cowboy Ventures, Basement Fund, and 40+ founders and C-level executives.
Company HQ
New York, United States
Number of Employees
Charthop has around 200 employees
Year Founded
2018
Amount Raised
Charthop has raised a total of $74.1 million in funding over 4 rounds. Their latest was a Series C in January 2023.
FAQ
About SSR

We spend hundreds of hours researching the best HR and recruiting software so you don’t have to. We never take money from vendors during our research phase and rely heavily on practitioners and experts to help us recommend the right software. However we may earn a small fee if you click on vendor links on this page.
